What is Vega?
Vega is a library that renders charts based on a JSON file. It’s become recently popular by the science community because it lets people easily build chart through a declarative specification. It’s even used by the Wikimedia Foundation to power some of the visualizations on Wikipedia.
A Vega chart is built based on 3 components:
- Data: in a JSON or CSV format
- Vega specification: the JSON file that describes the visualization
- Vega config: another JSON file that styles the visualization (optional)
How to use it?
Vega has a steep learning curve so we would recommend you to follow the official tutorials first: https://vega.github.io/vega/tutorials/.
In particular, Let’s Make A Bar Chart is a good first step for any beginner. It will introduce all the basic concepts of the specification: scales, axes, marks, signals, etc.
Once you’ve familiarized with Vega, have a look at the examples. If you would like to create a chart similar to the ones there, you can easily edit them in the online editor.
Using the online editor
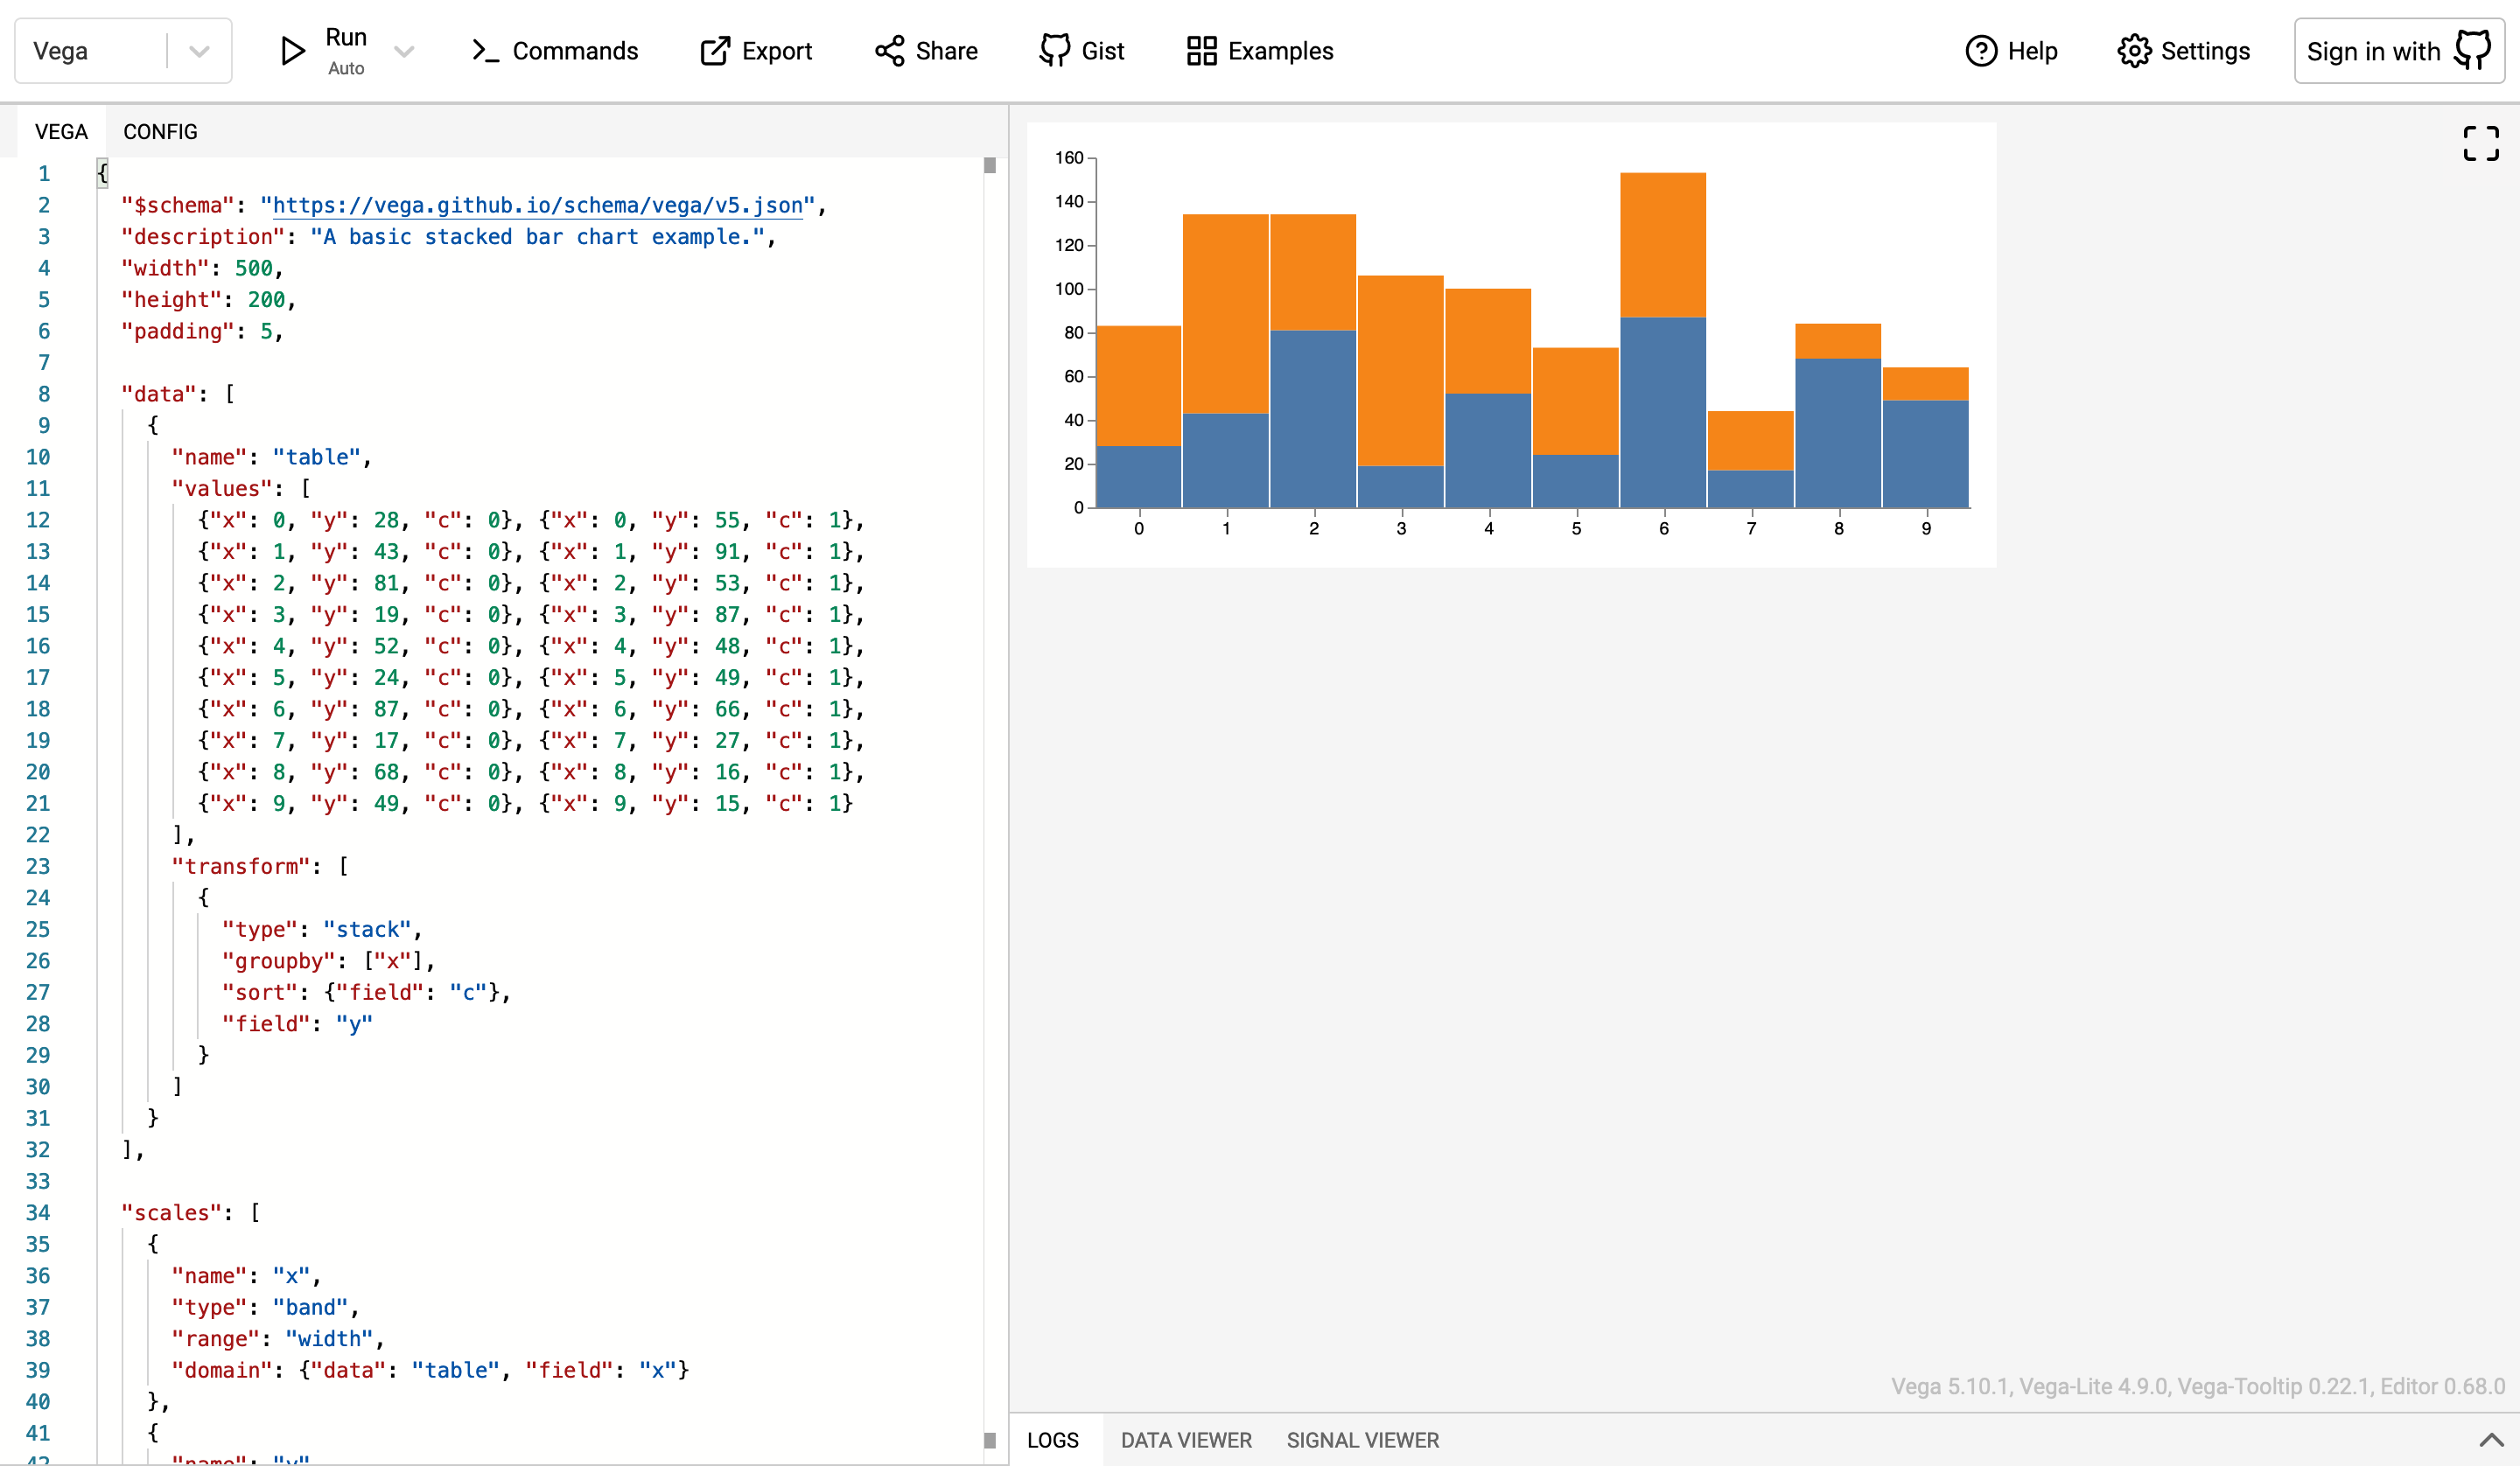
Vega’s online editor is the recommended way to build charts as it doesn’t require you to install anything. Plus, it contains a lot of examples for you to start with.

The interface is divided into 3 main sections:
- Toolbar: located at the top
- Editors: located on the left side
- Preview: located on the right side
In the toolbar, you’ll most likely be interested in two buttons.
The first one, Examples, will let you choose any of Vega’s examples as a starting point. When you click on it, a modal opens with a list of charts. At the top are two tabs: Vega and Vega-Lite. The difference between the two is that Vega-Lite is a trimmed down version of Vega. Feel free to use examples from any of the two, but note that the syntax of their specifications is not the same.
The second button, Export, will let you export your chart as an image (PNG or SVG) or the chart specification (JSON). If you choose the latter, you’ll be presented an option to include (embed) the “config”, which is the other JSON object containing the styles of the visualization.
On the left side of the interface are the editors. There are actually two of them: one for the specification and the other for the config. You can switch between one another by clicking the tabs at the top.
If you go over to the config editor, you will find a theme selector. This allows you to change the styles of the chart based on some presets. You will likely not use this option as a custom config object is included in this visual guide style.
The preview, on the right side, is automatically rendered each time you make modifications in the specification or config editor. If you enter some invalid JSON, a red error will be shown instead of the chart. The editor will also display a wiggly line below the code that contains the error.
